本文于2020-10-10更新。 如发现问题或者有建议,欢迎提交 Issue
1 Jupyter Notebook
2 构建两个x轴 (Kington 2010)
其中一个是group的性质。
import numpy as np
import matplotlib.pyplot as plt
import matplotlib as mpl

def annotate_group(name, xspan, ax=None):
    """Annotates a span of the x-axis"""
    def annotate(ax, name, left, right, y, pad):
        arrow = ax.annotate(name,
                xy=(left, y), xycoords='data',
                xytext=(right, y-pad), textcoords='data',
                annotation_clip=False, verticalalignment='top',
                horizontalalignment='center', linespacing=2.0,
                arrowprops=dict(arrowstyle='-', shrinkA=0, shrinkB=0,
                        connectionstyle='angle,angleB=90,angleA=0,rad=5')
                )
        return arrow
    if ax is None:
        ax = plt.gca()
    ymin = ax.get_ylim()[0]
    ypad = 0.01 * np.ptp(ax.get_ylim())
    xcenter = np.mean(xspan)
    left_arrow = annotate(ax, name, xspan[0], xcenter, ymin, ypad)
    right_arrow = annotate(ax, name, xspan[1], xcenter, ymin, ypad)
    return left_arrow, right_arrow

def make_second_bottom_spine(ax=None, label=None, offset=0, labeloffset=20):
    """Makes a second bottom spine"""
    if ax is None:
        ax = plt.gca()
    second_bottom = mpl.spines.Spine(ax, 'bottom', ax.spines['bottom']._path)
    second_bottom.set_position(('outward', offset))
    ax.spines['second_bottom'] = second_bottom

    if label is not None:
        # Make a new xlabel
        ax.annotate(label,
                xy=(0.5, 0), xycoords='axes fraction',
                xytext=(0, -labeloffset), textcoords='offset points',
                verticalalignment='top', horizontalalignment='center')

#-- Generate some data ----------------------------------------------------
nx = 10
x = np.linspace(0, 2*np.pi, 10)
y = 2 * np.sin(x)

groups = [('GroupA', (x[0], x[nx//3])),
          ('GroupB', (x[-2*nx//3], x[2*nx//3])),
          ('GroupC', (x[-nx//3], x[-1]))]

#-- Plot the results ------------------------------------------------------
fig = plt.figure()
ax = fig.add_subplot(111)

# Give ourselves a bit more room at the bottom
plt.subplots_adjust(bottom=0.2)

ax.plot(x,y, 'k^')

# Drop the bottom spine by 40 pts
ax.spines['bottom'].set_position(('outward', 40))

# Make a second bottom spine in the position of the original bottom spine
make_second_bottom_spine(label='Treatment')

# Annotate the groups
for name, xspan in groups:
    annotate_group(name, xspan)

plt.xlabel('Dose')
plt.ylabel('Response')
plt.title('Experimental Data')

plt.show()
plt.clf()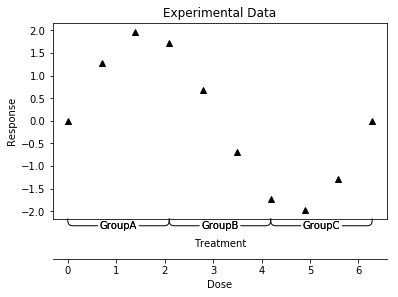
Kington, Joe. 2010. “How Do I Plot Multiple X or Y Axes in Matplotlib?” Stack Overflow. 2010. https://stackoverflow.com/questions/3918028/how-do-i-plot-multiple-x-or-y-axes-in-matplotlib.